Summary: Study of Jupiter atmosphere by means of JIRAM/Juno data for identifying strong periodic activity generated by thermo-dynamic phenomena.
Useful Skills: Programming, Planetology, Fourier Analysis
Abstract
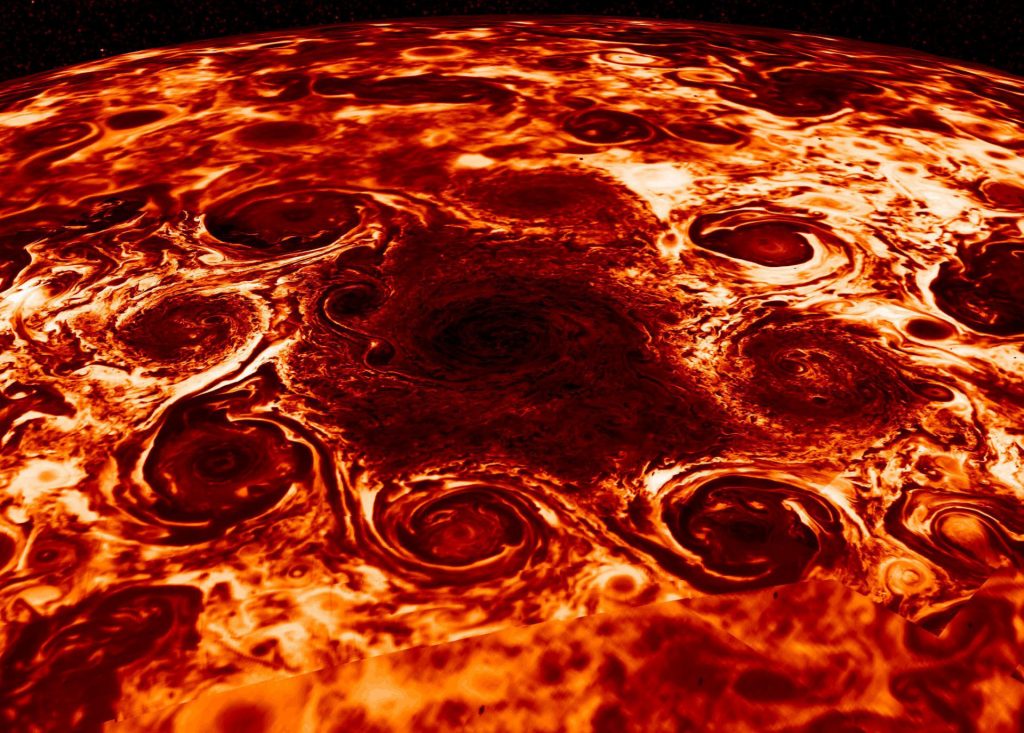
JIRAM (Jupiter Infrared Auroral Mapper), with its imager and slit spectrometer operating over the 2-5 μm [Adriani et al., 2014], is one of the two Italian instruments onboard the Juno spacecraft, launched on August 2011 with the goal of investigating the origin and evolution of Jupiter. JIRAM is acquiring data since July 2016 and many interesting results from their analysis have been already published on the principal scientific journals – see for example Adriani et al, 2018 on Nature (Figure 1); Mura et al., 2018 on Science; Moriconi et al., 2017 on GRL; Grassi et al., 2018 on JGR. However, the big amount of data has been only minimally used. The images acquired by the JIRAM imager in M band (IMG-M hereafter), centered at 4.78 μm with a 480 nm bandwidth, reproduce the pattern of clouds deep to ~ 5 bar. What JIRAM senses is the thermal emission of the deep layers, attenuated by the overlying clouds. Brightness signal scans by the IMG-M can be analyzed as spatial data records of frozen turbulence. Power spectra from these signals can be computed using Fast Fourier Transform analysis. Though this kind of power spectrum does not completely coincide with kinetic energy spectrum, there is some evidence of close similarity between the two behaviors, particularly at low wavenumber (Travis, 1978; Harrison et al., 1996).
Aim of this work is to use power spectra as a statistical tool for studying the distribution of power across Fourier components and as a device for identifying strong periodic activity at discrete wavenumber. JIRAM images can reach 1 km of spatial resolution during the flyby. This unprecedented detail permits to reveal periodic features up to ~2 km wavelength by power spectral analysis, where up to now it never measured gravity waves with wavelengths smaller than 150 km (Flasar and Gierasch, 1986).
References
A. Adriani, A., Filacchione, G., Di Iorio, T., et al. 2014, SSRv, 213, 393
A. Adriani, A. Mura, G. Orton, et al. 2018, Nature, 555, 216
A. Mura, A. Adriani, J. E. P. Connerney, et al. 2018, Science, 361, 774
M. L. Moriconi, A. Adriani , B. M. Dinelli, et al. 2017, GRL, 44,4641
D. Grassi , A. Adriani , M. L. Moriconi, et al. 2018, JGR: Planets, 123,1511
L. D. Travis, 1978, JAS, 35, 1584
J. Harrison, T. E. Dowling and R. L. Baron, 1996, Icarus, 124, 32